A mountain has more than one summer
The first stop is Marmot Creek, in Kananaskis Country, near Mount Allan. Here, the July 2024 satellite picture suggests a difference between slopes that face north and those that face south. One photograph is intriguing. Seven years let us ask whether the pattern repeats.
The comparison follows the same selected patches of ground from 2019 through 2025, all between 2,200 and 2,400 metres. Keeping them within the same height band makes the comparison more useful: we are looking across slopes, rather than comparing a valley with a summit.
In every year, the north-facing group reached the estimated end of its main snow season later. The difference between the groups’ middle dates was 13–20 days. A middle date is simply the point halfway through the patches when their dates are sorted from earliest to latest.
That gives a skier a place to investigate and a hiker a reason to check for lingering snow. These dates describe the main stretch of seasonal snow cover. Small patches can outlast it, and a slope can become too thin or broken up to ski before it ends.
The same slopes, a different June
The direction of the difference held. The calendar moved.
For the north-facing group, the middle date was June 29 in 2022 and May 27 in 2023: 33 days apart. A late-June visit in those two years would fall on very different sides of the estimated end of the main snow season. Remembering a promising date from last year would miss that change.
The paired dates below show both parts of the story: the gap between north and south within each year, and the changing dates across years. Dates move both earlier and later through this short record, so it does not establish a steady trend toward earlier snow loss.
North-facing ground was a consistent clue in this sample. Choosing a day still requires evidence from the season you intend to visit.
Alberta / Marmot Creek–Mount Allan / 2,200–2,400 m
North lasts longer.
The calendar moves.
The estimated end of the main snow season came later on the selected north-facing slopes in all 7 years — by 13–20 days.
33 daysearlier on the north-facing sample in 2023 than 2022.
The highlighted years put the contrast in perspective: the north-facing middle date moved from Jun 29 to May 27. Slope direction alone does not give you a reliable trip date.
Exact dates, selected terrain and uncertainty
| Year | South | North | North later | Input uncertainty medians, S / N |
|---|---|---|---|---|
| 2019 | May 22 | Jun 11 | 20 days | 7 / 7 days |
| 2020 | Jun 4 | Jun 21 | 17 days | 7 / 10 days |
| 2021 | Jun 1 | Jun 16 | 15 days | 4.5 / 4.5 days |
| 2022 | Jun 14 | Jun 29 | 15 days | 7 / 7 days |
| 2023 | May 12 | May 27 | 15 days | 1 / 7 days |
| 2024 | Jun 10 | Jun 23 | 13 days | 11 / 7 days |
| 2025 | May 12 | May 27 | 15 days | 4.5 / 1 days |
The same 1,014 north-facing and 562 south-facing cells are retained across all seven years. These are different locations, not causal controls. Selection requires slopes of at least 5°, seasonal-snow status, a finite seasonal end estimate and input uncertainty no greater than 15 days in every year. Missing and persistent-snow/ice cells are excluded; this is a subset of the terrain.
North means aspect 315°–45°; south means 135°–225°. Each date is a descriptive median, rounded to a day from its annual epoch. The uncertainty column summarizes the input uncertainty values; it is not a confidence interval for the median. Spatially correlated terrain cells are not independent trials. Lines connect the two medians, not uncertainty bounds.
Fixed-cohort dates and method · Source datasets and provenance
Follow the snow through the approach
A promising slope is only part of an outing. The ground between it and the trailhead determines how much walking comes before the snow—and whether the snowy sections connect.
For that question, the explorer moves to a second place: the Peyto area, near the Wapta Icefield. Mount Allan supplies the repeated north–south comparison; Peyto offers a separate ski-touring example in which to examine a route. The result from one place is not a measurement of the other.
The Wapta is glacier-touring terrain. Parks Canada identifies April and May as the recommended alpine touring season on the icefields and snow peaks along the Continental Divide. Travelling there requires avalanche and glacier-travel skills. Its appearance in a summer explorer is an opportunity to study the changing cover, not a recommendation for a summer ski trip.
Choose Bow Summit · Peyto, then Wapta Icefield Routes. On July 7, 2024, every sampled map square along the displayed segment was labelled snow or ice. By August 1, fewer than half were; the rest were labelled clear land, water or unknown.
The height chart gives that line a side view. Follow it along the route and use the position marker to locate the changing colours on the map. Look for interruptions between snowy sections. A white upper slope can draw the eye while the approach tells a different story. Water labels are another reason to examine this mapped segment carefully before treating it as an itinerary.
Peyto / Follow the approach
The mountain.
The route. The remaining snow.
Start with a route, then watch where snow remains as summer advances. The white patches show where a satellite detected snow or ice on that date. They do not tell us whether there is enough snow to ski.
Historical satellite observations, mapped trail segments and real elevation. Your own GPX stays in this browser.
Select a route and an observation date to investigate snow along the way.
These are route examples, not checked trip plans. Use them to explore historical snow, then check current conditions before choosing a trip.
About this mapped route
Both explorers follow the same mountain when you change the study window.
Choose a year, then move the date slider through its selected June–September observations. Only years with imported scenes appear. Look for white patches shrinking, remaining, or returning. Grey hatching means we cannot see clearly—not that the snow has gone. These are dated observations, not a forecast for your trip.
Drag to rotate. Use + / − to zoom. On a phone, scroll beside the map or turn drag off to scroll over it.
Read the route
Where does this route cross snow?
Read this line from left to right as a journey: uphill on the chart means higher ground. Its colours show the satellite result along the route. Move the slider to place the marker on the map and find which part of the climb a snow patch belongs to. If everything is clear land or unknown, try an earlier date; the chart cannot turn an obscured view into evidence of snow.
Profile values and observation classes
Check the evidence
What could the satellite see?
The colour photograph helps you spot clouds, shadows and the surrounding landscape. It is a visual check on the snow map, not another measurement of snow depth.
Show the photograph for this date
Compare nearby slopes (optional)
Look at nearby slopes at a similar elevation. Do they face a different direction? Does the same patch remain visible on another clear date?
A higher percentage here means more of the ground we could classify carried snow or ice on this date. It does not measure snow depth or prove that a slope is skiable.
What these observations can—and cannot—tell us
Sentinel-2 classifies snow and ice together. Cloud, shadow, unclassified pixels and missing coverage stay unknown. Vegetation is a land classification, not proof that ground underneath a canopy is snow-free. Water is separate. The 20 m source classification is aligned to the existing 30 m analysis grid; it cannot resolve the width of a trail.
Trail lines are OpenStreetMap features, not verified trip itineraries. Some are partial segments. The elevation model can miss small cliffs and gullies. Historical observations do not establish present-day access, snow depth, avalanche stability or a safe route.
Potential sunlight is a terrain calculation under stated assumptions, not observed weather or a snowmelt forecast. Use official trail conditions and avalanche forecasts for current planning.
© OpenStreetMap contributors / ODbL · Copernicus Sentinel-2 classification · Observation index · Route data and provenance
For a closer look at the history of one place, open the annual explorer below. It follows the area selected on the route map. If you stay at Peyto, you are examining Peyto’s history; the seven-year north–south finding above belongs to Mount Allan.
Explore how the snow season changed in one place
These colours show estimated seasonal end dates, rather than snow visible on a particular day. Some glacier-covered or uncertain places have no comparable date. The selected area follows the route map above.
Optional / Compare seasonal timing
Same slope. Different year.
Would the same trip have met a different snow season in another year? Compare the same ground across seven winters and springs.
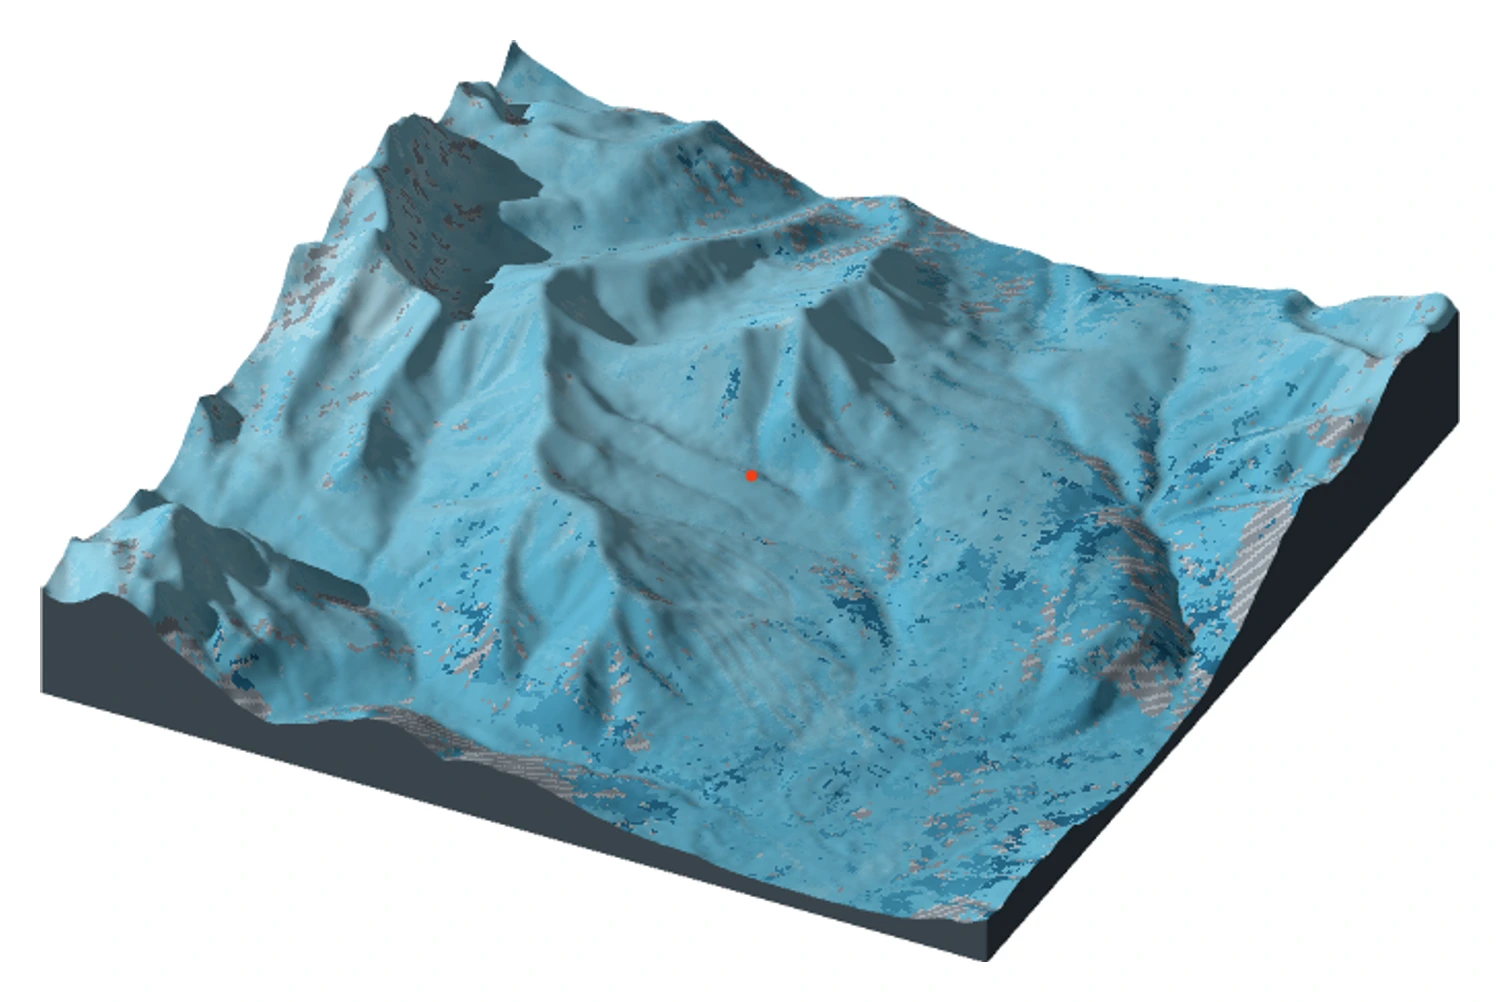
Three Alberta windows. Seven snow years.
A landscape you can turn, compare and inspect.
Historical annual estimates, 2018–19 to 2024–25. Not current conditions.
Drag to explore · click to inspect
Slide the divider across a ridge to compare the same place in two years. Lighter blue and white mean the main snow season ended later; they do not mean deeper snow. Click a place, then open “Inspect a place” for its dates. A big difference is a reason to avoid treating last year's calendar as this year's plan.
Mouse-wheel scrolling moves the page. Use + / − to zoom. With drag enabled, drag to pan the plan view or rotate the terrain. Turn drag off to scroll on touchscreens. The terrain view is shaded; use plan view for unshaded colours.
Map details & data resolution
Inspect a place (optional)
This is a closer look at one selected spot, not a trend for the whole mountain. Some years may be too uncertain to compare. Use the regional comparison above for the main story.
Selected-year data table Keyboard access to every grid cell
Rows preserve all classifications and missing values. Use the grid coordinates to inspect any cell. Only the current page of cells is shown; the JSON download contains the full study window.
| Cell | Biggest period ends | Uncertainty | Classification / eligibility |
|---|
A dated view from above Sentinel-2 true colour · separate from the snow layer
How much of each window qualifies? All seven years · available without JavaScript
Percentage of the 90,000 source cells in each 81 km² window with seasonal status 0, a reported end date, and uncertainty ≤ ±15 days. Excluded cells include perennial snow/ice, other classifications and wider observation gaps. These percentages describe data qualification, not snow-covered area.
| Study window | 2018–19 | 2019–20 | 2020–21 | 2021–22 | 2022–23 | 2023–24 | 2024–25 |
|---|---|---|---|---|---|---|---|
| Marmot Creek · Mount Allan | 61.7% | 78.9% | 89.8% | 75.0% | 84.5% | 85.6% | 90.7% |
| Bow Summit · Peyto | 6.8% | 4.3% | 14.9% | 11.2% | 40.7% | 32.5% | 37.4% |
| Jasper · Marmot Basin | 71.6% | 64.4% | 84.0% | 64.0% | 90.7% | 77.6% | 94.1% |
The glacier-bearing Peyto window has much less qualified seasonal-date coverage. A low percentage is a reason to inspect the classifications, not evidence of early melt.
End of the biggest snow period, not necessarily the last summer snow patch. The source class includes snow and ice.
A satellite cannot always see through clouds or tree cover. A blank or uncertain date means we do not know, not that the ground was clear.
Use past years to understand how much timing can change. Use current reports and avalanche forecasts to decide whether a trip is suitable now.
Data, definitions & downloads
Natural Resources Canada’s annual 30 m snow-dynamics product, seven snow years from 2018–19 through 2024–25. This atlas contains bounded regional extracts, not all of Alberta.
NRCan dataset and documentation · Download the data manifest
Before choosing a day
The maps make the next questions more specific. Where does continuous snow begin? Is the report you found about that approach or a slope much higher up? Was the ground visible in the satellite picture, or hidden by cloud? Unknown areas leave the question open.
For a skier, those questions help separate the appeal of a few turns from the work of reaching them. For a hiker, they identify sections where a recent account could change the plan. Snow depth, surface firmness and stability still need other evidence; the satellite colours cannot supply them.
This collection ends in 2025. Before an outing, look for recent reports from the intended route, check access and weather, and consult the applicable avalanche forecast. Parks Canada’s touring guidance explains the preparation these mountains require.
In this sample, the north-facing group reached the estimated end of its main snow season 13–20 days later than the south-facing group, even as its date shifted by 33 days between two years. That makes direction a useful starting point for deciding where to look. The approach determines what reaching that snow would involve, so the next useful evidence is a recent report covering the ground you would actually travel.
A closer look: four pictures of summer 2024
Supporting views · Summer 2024
Where is the snow?
Four clues, not a forecast.
Start with the question each picture answers. Together they show where snow remained in summer 2024—and how to avoid mistaking a cloudy image for a clear route.
These figures show fixed 2024 observations; the explorer controls do not change them. A compares all three areas; B–D examine Marmot Creek, a separate example from the Peyto ski route. On smaller screens, scroll wide charts sideways.
Observation strips
Did the snow go, or did the view disappear?
Look at Peyto on June 22: most of the bar is hatched. The satellite could not see enough to tell us what happened to the snow. A small blue bar on that date does not mean a mostly clear mountain. Compare it with July 7, when much more of the ground was visible.
- Snow / ice
- Clear land
- Water
- Unknown
Marmot Creek
Bow Summit / Peyto
Jasper / Marmot Basin
Takeaway: check the hatched area before trusting the blue area. A mostly hidden scene is a reason to look for another observation. Each bar shows the whole study window, with its own date; clear land can include trees hiding snow underneath.
Observation counts and original scenes
| Window | Scene | Snow / ice | Clear land | Water | Unknown |
|---|---|---|---|---|---|
| Marmot Creek | Jun 7 | 29,151 | 46,970 | 8 | 13,871 |
| Marmot Creek | Jun 29 | 16,688 | 28,175 | 1 | 45,136 |
| Marmot Creek | Jul 7 | 8,287 | 78,478 | 15 | 3,220 |
| Marmot Creek | Jul 24 | 510 | 85,436 | 10 | 4,044 |
| Marmot Creek | Aug 1 | 212 | 85,118 | 14 | 4,656 |
| Marmot Creek | Aug 31 | 75 | 82,155 | 6 | 7,764 |
| Marmot Creek | Sep 5 | 10 | 85,459 | 8 | 4,523 |
| Marmot Creek | Sep 25 | 0 | 74,134 | 14 | 15,852 |
| Bow Summit / Peyto | Jun 7 | 79,782 | 6,866 | 746 | 2,606 |
| Bow Summit / Peyto | Jun 22 | 11,157 | 151 | 152 | 78,540 |
| Bow Summit / Peyto | Jul 7 | 61,921 | 23,841 | 1,578 | 2,660 |
| Bow Summit / Peyto | Jul 17 | 48,315 | 35,919 | 1,883 | 3,883 |
| Bow Summit / Peyto | Aug 1 | 31,458 | 47,075 | 4,457 | 7,010 |
| Bow Summit / Peyto | Aug 31 | 23,887 | 48,213 | 5,336 | 12,564 |
| Bow Summit / Peyto | Sep 5 | 15,455 | 56,107 | 10,778 | 7,660 |
| Bow Summit / Peyto | Sep 30 | 8,942 | 2,227 | 910 | 77,921 |
| Jasper / Marmot Basin | Jun 7 | 27,501 | 52,599 | 225 | 9,675 |
| Jasper / Marmot Basin | Jun 17 | 36,646 | 34,799 | 225 | 18,330 |
| Jasper / Marmot Basin | Jul 7 | 5,729 | 81,432 | 348 | 2,491 |
| Jasper / Marmot Basin | Jul 17 | 682 | 83,994 | 342 | 4,982 |
| Jasper / Marmot Basin | Aug 11 | 0 | 66,785 | 312 | 22,903 |
| Jasper / Marmot Basin | Aug 19 | 0 | 80,302 | 303 | 9,395 |
| Jasper / Marmot Basin | Sep 5 | 0 | 85,973 | 391 | 3,636 |
| Jasper / Marmot Basin | Sep 18 | 0 | 49,764 | 927 | 39,309 |
Elevation × observation
In early July, the snow was higher up.
Read the July 7 column upwards. Around 2,000–2,200 metres, about 4% of the ground the satellite could classify was snow or ice. At 2,600–2,800 metres, it was 57%. The lower slopes and the high mountain were having very different summers.
The large number is the snow/ice share of visible land. The small number is the share of the whole band the satellite could not classify. Marmot Creek, summer 2024; slopes of at least 5°. Each row covers 200 metres of height, from its lower bound up to—but not including—the upper one.
| Elevation | ||||||||
|---|---|---|---|---|---|---|---|---|
| 2,800–3,000 | 100.0%0.9% unknown; 754 snow or ice, 0 clear land, 0 water, 7 unknown cells | 100.0%0.7% unknown; 756 snow or ice, 0 clear land, 0 water, 5 unknown cells | 95.9%10.8% unknown; 651 snow or ice, 28 clear land, 0 water, 82 unknown cells | 3.1%31.7% unknown; 16 snow or ice, 504 clear land, 0 water, 241 unknown cells | 2.3%32.5% unknown; 12 snow or ice, 502 clear land, 0 water, 247 unknown cells | 3.5%43.2% unknown; 15 snow or ice, 417 clear land, 0 water, 329 unknown cells | 0.0%38.8% unknown; 0 snow or ice, 466 clear land, 0 water, 295 unknown cells | 0.0%55.3% unknown; 0 snow or ice, 340 clear land, 0 water, 421 unknown cells |
| 2,600–2,800 | 100.0%1.9% unknown; 2,700 snow or ice, 0 clear land, 0 water, 53 unknown cells | 100.0%15.0% unknown; 2,338 snow or ice, 1 clear land, 0 water, 414 unknown cells | 57.0%10.4% unknown; 1,405 snow or ice, 1,062 clear land, 0 water, 286 unknown cells | 5.6%23.9% unknown; 118 snow or ice, 1,978 clear land, 0 water, 657 unknown cells | 3.6%24.9% unknown; 75 snow or ice, 1,993 clear land, 0 water, 685 unknown cells | 3.0%32.4% unknown; 55 snow or ice, 1,805 clear land, 0 water, 893 unknown cells | 0.5%22.7% unknown; 10 snow or ice, 2,117 clear land, 0 water, 626 unknown cells | 0.0%48.5% unknown; 0 snow or ice, 1,417 clear land, 0 water, 1,336 unknown cells |
| 2,400–2,600 | 95.5%6.3% unknown; 7,723 snow or ice, 364 clear land, 0 water, 541 unknown cells | 93.3%20.8% unknown; 6,378 snow or ice, 459 clear land, 0 water, 1,791 unknown cells | 31.1%8.1% unknown; 2,468 snow or ice, 5,460 clear land, 0 water, 700 unknown cells | 2.6%14.0% unknown; 190 snow or ice, 7,227 clear land, 0 water, 1,211 unknown cells | 1.2%14.7% unknown; 88 snow or ice, 7,270 clear land, 0 water, 1,270 unknown cells | 0.0%21.5% unknown; 0 snow or ice, 6,772 clear land, 0 water, 1,856 unknown cells | 0.0%15.0% unknown; 0 snow or ice, 7,336 clear land, 0 water, 1,292 unknown cells | 0.0%31.5% unknown; 0 snow or ice, 5,909 clear land, 1 water, 2,718 unknown cells |
| 2,200–2,400 | 83.5%9.0% unknown; 11,240 snow or ice, 2,225 clear land, 8 water, 1,331 unknown cells | 60.9%34.1% unknown; 5,936 snow or ice, 3,819 clear land, 0 water, 5,049 unknown cells | 20.4%4.9% unknown; 2,874 snow or ice, 11,201 clear land, 0 water, 729 unknown cells | 1.1%6.4% unknown; 150 snow or ice, 13,711 clear land, 0 water, 943 unknown cells | 0.2%7.6% unknown; 29 snow or ice, 13,656 clear land, 0 water, 1,119 unknown cells | 0.0%11.8% unknown; 0 snow or ice, 13,051 clear land, 0 water, 1,753 unknown cells | 0.0%8.0% unknown; 0 snow or ice, 13,620 clear land, 3 water, 1,181 unknown cells | 0.0%24.8% unknown; 0 snow or ice, 11,117 clear land, 11 water, 3,676 unknown cells |
| 2,000–2,200 | 37.4%26.2% unknown; 4,811 snow or ice, 8,051 clear land, 0 water, 4,574 unknown cells | 11.3%61.6% unknown; 753 snow or ice, 5,937 clear land, 0 water, 10,746 unknown cells | 3.5%4.0% unknown; 592 snow or ice, 16,143 clear land, 8 water, 693 unknown cells | 0.0%2.8% unknown; 8 snow or ice, 16,940 clear land, 6 water, 482 unknown cells | 0.0%3.3% unknown; 3 snow or ice, 16,850 clear land, 9 water, 574 unknown cells | 0.0%5.7% unknown; 0 snow or ice, 16,436 clear land, 4 water, 996 unknown cells | 0.0%3.5% unknown; 0 snow or ice, 16,829 clear land, 4 water, 603 unknown cells | 0.0%19.2% unknown; 0 snow or ice, 14,095 clear land, 1 water, 3,340 unknown cells |
| 1,800–2,000 | 6.0%25.8% unknown; 844 snow or ice, 13,131 clear land, 0 water, 4,848 unknown cells | 0.4%56.3% unknown; 31 snow or ice, 8,192 clear land, 1 water, 10,599 unknown cells | 0.0%1.5% unknown; 2 snow or ice, 18,538 clear land, 0 water, 283 unknown cells | 0.0%1.1% unknown; 0 snow or ice, 18,610 clear land, 0 water, 213 unknown cells | 0.0%1.4% unknown; 0 snow or ice, 18,556 clear land, 0 water, 267 unknown cells | 0.0%4.4% unknown; 0 snow or ice, 17,989 clear land, 1 water, 833 unknown cells | 0.0%1.8% unknown; 0 snow or ice, 18,481 clear land, 0 water, 342 unknown cells | 0.0%10.8% unknown; 0 snow or ice, 16,782 clear land, 0 water, 2,041 unknown cells |
| 1,600–1,800 | 2.0%13.5% unknown; 199 snow or ice, 9,613 clear land, 0 water, 1,531 unknown cells | 0.0%47.4% unknown; 0 snow or ice, 5,969 clear land, 0 water, 5,374 unknown cells | 0.0%1.3% unknown; 0 snow or ice, 11,200 clear land, 0 water, 143 unknown cells | 0.0%0.5% unknown; 0 snow or ice, 11,281 clear land, 0 water, 62 unknown cells | 0.0%1.9% unknown; 0 snow or ice, 11,126 clear land, 0 water, 217 unknown cells | 0.0%6.1% unknown; 0 snow or ice, 10,646 clear land, 0 water, 697 unknown cells | 0.0%0.6% unknown; 0 snow or ice, 11,276 clear land, 0 water, 67 unknown cells | 0.0%12.0% unknown; 0 snow or ice, 9,983 clear land, 0 water, 1,360 unknown cells |
Takeaway: a clear valley does not tell you whether the upper route still crosses snow. Follow the full climb. This picture says where snow or ice was detected, not whether it formed a continuous, deep-enough ski run.
Slope direction
North held more snow.
On this date.
July 7 · Marmot Creek · 2,200–2,400 m · slopes ≥5°
At roughly the same height, 47% of classified north-facing ground was snow or ice, compared with 12% facing south. North is a useful clue for where to investigate—not a promise of July skiing. About 18.7% of the north-facing ground was hidden or unresolved, versus 0.0% facing south. The seven-year comparison earlier in the article checks whether the broader north/south pattern repeats.
Direction counts and missing observations
| Direction | Snow / ice | Clear land | Water | Unknown |
|---|---|---|---|---|
| N | 1,029 | 1,168 | 0 | 506 |
| E | 1,006 | 3,756 | 0 | 72 |
| S | 429 | 3,082 | 0 | 0 |
| W | 410 | 3,195 | 0 | 151 |
Two-date transition
What changed on
the visible ground?
Marmot Creek · June 7 → July 24, 2024
25,712 cells switched from snow / ice to clear land.
Here we keep only ground that could be classified on both dates, so a cloudier picture cannot explain the difference. Of the 26,222 squares labelled snow or ice on June 7, 25,712 were labelled clear land by July 24—about 98%. Takeaway: the summer change was substantial in this shared view. It does not give the exact day a route became clear. The remaining 16,856 squares were left out because one date was unknown or water.
Transition counts
| June 7 → July 24 | Cells |
|---|---|
| Snow / ice → Snow / ice | 510 |
| Snow / ice → Clear land | 25,712 |
| Clear land → Snow / ice | 0 |
| Clear land → Clear land | 46,922 |
Source: archived Sentinel-2 Level-2A scene classifications, resampled to the shared 30 m analysis grid; elevation and direction from the terrain model. Download the counts and source links. These are historical observations, not present-day trail or avalanche conditions.
Behind the story: the comparison, the maps and AI
The annual estimates come from Natural Resources Canada’s snow-dynamics dataset. They describe the end of the largest snow-covered period, estimated from the gap between satellite observations. They are not exact dates of final melt or last skiable snow.
The Mount Allan comparison retains 1,014 north-facing and 562 south-facing 30-metre cells between 2,200 and 2,400 metres, on slopes of at least 5°. Every retained cell has a seasonal-snow estimate with reported timing uncertainty no greater than ±15 days in all seven years. These are approximately 38% of the north-facing and 16% of the south-facing candidate cells. The selection favours ground with usable records. It does not represent every slope, and matching height does not isolate direction from other terrain differences.
Seven-year calculations. The difference between the rounded north-facing dates in 2022 and 2023 is 33 calendar days. Descriptive middle dates are not confidence intervals, and neighbouring cells are not independent measurements.
The separate summer sequence contains 168 Sentinel-2 observations: eight dates per summer, for seven summers from 2019–2025, in each of three study windows. The fixed worked figures show 2024. Their observation strips include all three windows, including a separate Jasper / Marmot Basin window. Marmot Basin is not Marmot Creek: the elevation, direction and change figures concern Marmot Creek near Mount Allan. These figures do not change when an explorer control changes. Clouds and shadow remain unknown. Clear-land labels can miss snow under trees, and snow/ice labels do not distinguish a skiable surface. Local ground measurements have not validated these classifications.
The Peyto example samples 144 unique map cells along one segment labelled “Wapta Icefield Routes.” On July 7, 2024, all 144 were labelled snow/ice. On August 1, the counts were 62 snow/ice, 46 clear land, 33 water and three unknown. These are sampled cells, not measurements of skiable route length or a survey of the full Wapta. Observation counts.
AI agents helped research the sources, process the data and build the interface. Checks compared exported values with original satellite pixels and tested route coordinates. Those checks establish agreement between the source values, files and maps; they do not establish conditions on the ground. Annual data and methods · Summer observations and sources.
Trying your own route on the map
A GPX file stores a route as GPS points. A Wapta trip report from March 2008 links the party’s recorded tracks. Download the file from the author’s page, choose Bow Summit · Peyto, then Upload your route (.gpx). Only parts of two of its ten tracks cross this small study window and receive snow and height information. The explorer starts in 2024; its observations cover 2019–2025, not the party’s 2008 outing.
The author warns against using the old track for navigation. It is an upload example; glacier terrain changes, and an old track cannot establish today’s route. The built-in mapped lines also include hiking routes; their presence is not a ski recommendation.