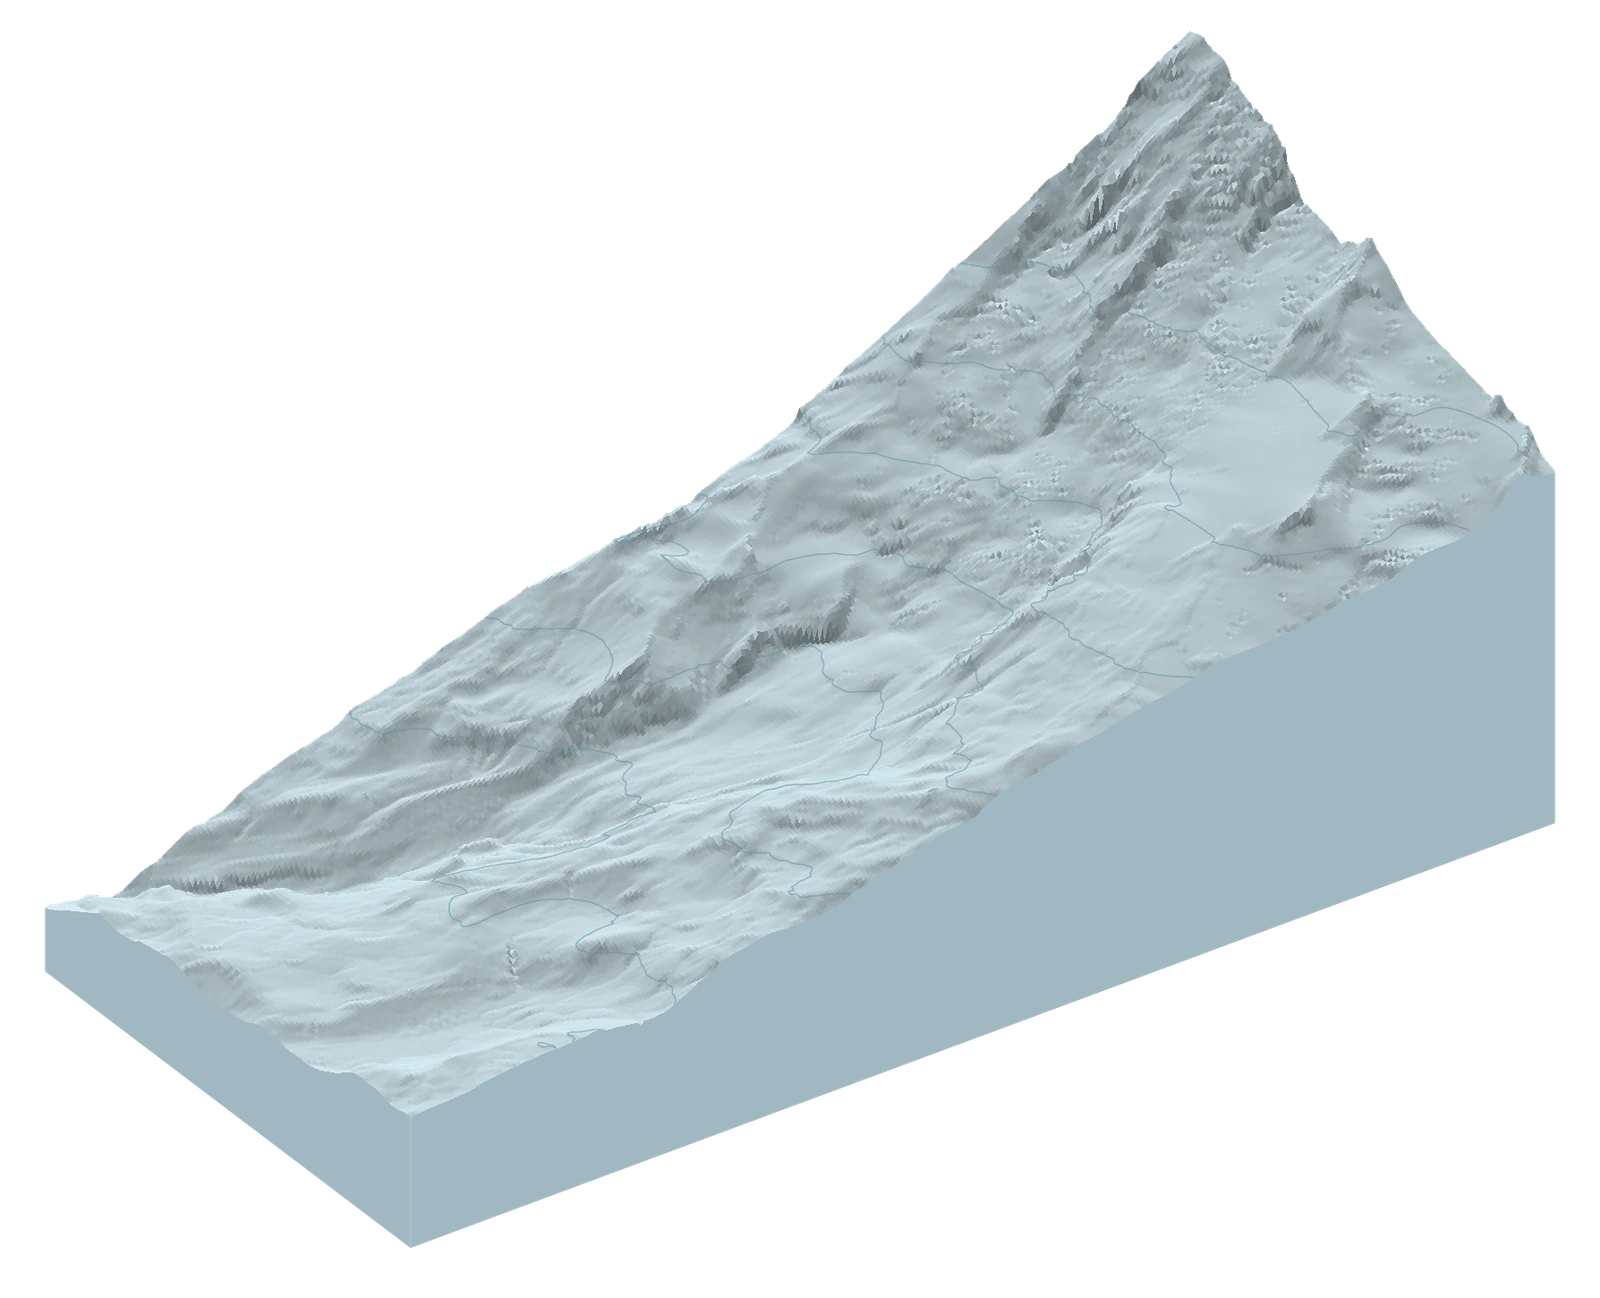
A season that shifts by weeks
At the nearby Paradise station, the water stored in the snowpack reached a sustained zero as early as June 17 in one summer and as late as July 27 in another. That is a 40-day spread across eight summers, from 2019 through 2026. Here, sustained means the reading stayed at zero for a week; it measures water content, not the height of the snow.
That spread makes a familiar date a shaky starting point for imagining the approach. In 2026 the sequence began 20 days earlier than in 2025. It does not mean 20 fewer skiable days: the station measures one place near Paradise, while the ground you are interested in rises far above it.
Use the terrain view to follow that climb. Look for where the observations change with height, and keep the unknown areas in view. A cloud-obscured patch has not been shown to melt out.
Eight summers / Paradise station
The season shifts by weeks.
From June 17 to July 27 across 2019–2026. The latest summer sits at the early end of this observed range.
Station measurement, exact dates and missing readings
SWE is snow-water equivalent: stored water, not physical snow depth. Each plotted date is the first day of seven consecutive zero readings; the table also gives the seventh-day confirmation. Missing days stay unknown.
| Year | SWE start | Confirmed | Depth start |
|---|---|---|---|
| 2019 | Jun 30 | Jul 6 | Jun 19 |
| 2020 | Jul 23 | Jul 29 | Jul 13 |
| 2021 | Jul 14 | Jul 20 | Jul 14 † |
| 2022 | Jul 27 | Aug 2 | Jul 21 |
| 2023 | Jul 1 | Jul 7 | Jun 25 |
| 2024 | Jul 14 | Jul 20 | Jul 5 |
| 2025 | Jul 7 | Jul 13 | Jun 29 |
| 2026 | Jun 17 | Jun 23 | Jun 7 |
† Missing 2021 depth readings could hide a run beginning July 3; July 14 is only the first witnessed start. Missing days break a witnessed run. Later snow can return after any zero run.
NRCS Paradise station daily report · readings checked through 2026-11-13. Eight summers describe variability; no climate-trend test is claimed.
Explore in 3D / From Paradise to the upper slopes
Look beyond the station.
Start with August 24, 2026, then explore another date or summer from 2019–2026. Look for snow and ice higher up as the season progresses. The thin contour lines show height; the red line connects NPS landmarks.
Only views with at least 70% known on the sampled ascent, wider map and upper band are offered. Unknown cells remain hatched even in qualifying views.
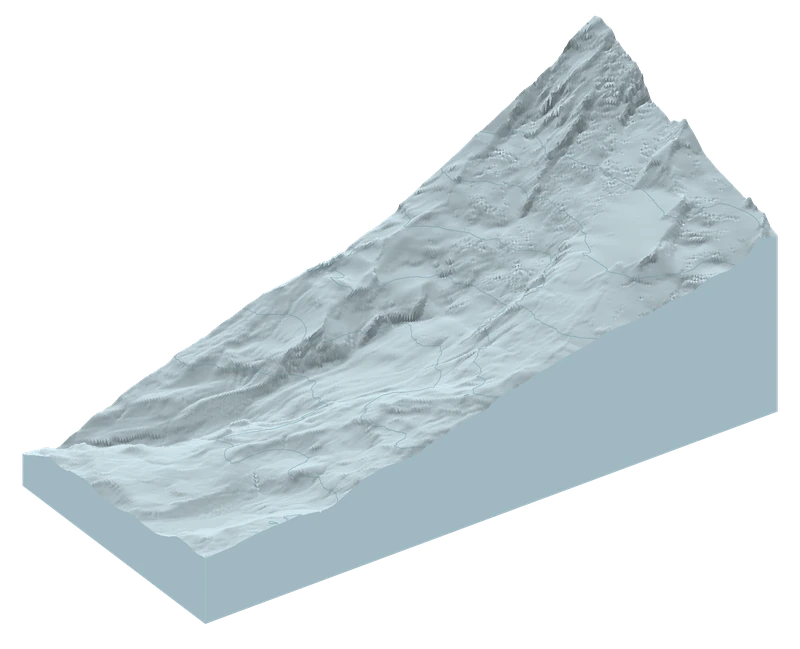
Interactive terrain loads as you reach it. Expand the evidence below for the charts.
The orange point marks Paradise station. Pale areas are snow or ice; grey hatching is unknown, not bare ground.
The red line connects NPS landmarks. It is a reference, not a recorded ski track or a recommended descent.
Map sources, route download and limitations
All 501 May–September dates across 2019–2026 were read. Offered dates need at least 70% known on the same date across the ascent, wider map and upper elevation band. Comparison pairs also need at least 70% common known ground. The three pairs were selected by date and visibility, not snow amount.
The red line connects seven National Park Service waypoints. It is not the recorded ascent used for the article’s 414 samples. Download NPS reference waypoints (.gpx). These landmark connections do not trace an exact travel path.
USGS elevations form the 3D surface, at true vertical scale. Sentinel-2 supplies dated 20-metre snow/ice classifications. Contours are spaced 250 metres apart, with labels every 500 metres. Grey hatching means unknown: it must not be read as bare ground. The view covers the wider Paradise–Camp Muir flank, not Rainier’s summit. The route overlay is a reference line, not a report of current travel conditions.
The maps show the full landscape window; the figures below count only the same 414 sampled ascent cells. Their percentages describe different areas. The 2019–2026 products use different processing versions, so this is an exploratory comparison, not a measured climate trend or a current conditions report.
USGS terrain · Sentinel-2 classification · Map data and sources
Read the station and map together: a low reading near Paradise is not a measurement of the snowfield above. Each date is another opportunity to look uphill.
Why show 2026? Compare the quality of recent observations
Choosing a recent summer
2026 has steadier monthly coverage. 2025 has more clear views.
10 vs 15 daysWorst gap within a month: 2026 vs 2025.
15 days in bothWorst gap across the full summer.
What counts as usable?
At least 70% known classification on the same date in each of three areas: the sampled ascent, the wider map and the upper elevation band. Cloud and shadow stay unknown. All 501 May–September observations across eight years were actually read; the map offers qualifying dates.
2025 has less obscuration and one processing version. At a stricter 90% visibility threshold, 2025 also has the shorter full-summer gap. Different criteria can favour a different year.
What changed between 2025 and 2026?
By late August, the selected views tell different stories. On August 24, snow or ice appeared on roughly two-fifths of the sampled ground that could be compared in both years in 2025, against about a quarter in 2026. Higher up, above 2,500 metres, the contrast was stronger: about three-quarters versus less than a third.
For someone looking for late-summer turns, that is a reason to investigate the higher ground afresh rather than repeat last year’s expectations. These are the same sampled locations, but the images cannot tell whether the remaining snow forms a connected descent or what its surface feels like.
The difference also depends on when you look. On June 23, all the ground visible and comparable in both years was classified snow/ice, although part of the footprint was excluded. On September 16, the comparison reversed, with more snow/ice labels in 2026; new snow may contribute to that picture. July’s pair is withheld because too little of the same ground could be compared.
These snapshots support a dated comparison, not a verdict that one entire summer was snowier. Different satellite-processing versions also limit how precisely the apparent change can be interpreted.
The same ground / recent summers
Same slopes. Different snapshots.
An earlier station zero does not settle what remains uphill. Even the direction of the comparison changes later in the summer.
Jun 23
Both views still show snow/ice
Only the shared clear portion is compared; part of the footprint could not be compared.
Aug 24
Less snow/ice in 2026
Almost all of the sampled ground was visible in both views.
Sep 16
The direction reverses
September may include fresh snow, not only snow surviving from spring.
July: not enough clear overlap for a fair comparison.
Exact counts, overlap and processing
| Date | Common known / full sample | 2025 snow/ice | 2026 snow/ice |
|---|---|---|---|
| Jun 23 | 314/414 cells | 314/314 | 314/314 |
| Jul 23 | 279/414 cells | Withheld | Withheld |
| Aug 24 | 409/414 cells | 174/409 | 110/409 |
| Sep 16 | 411/414 cells | 127/411 | 197/411 |
July 23 has only 279/414 common known cells, below the 70% threshold. Its 2025 view also fails the individual visibility gate. Unknown does not mean snow-free. June compares 314/414 cells, leaving 100 outside the paired result.
All pairs use the same calendar date in each year. A declared quality-only rule chose them near monthly targets, without ranking snow amount. Full-sample counts, including unknowns, remain in the underlying evidence; the map covers a larger area than these samples.
On Aug 24, all 119 cells above 2,500 m were known in both years: 89 classified snow/ice in 2025, versus 35 in 2026. This does not establish snow quality or connected cover.
Processing versions are 05.11 (2025) and 05.12 (2026). These source-bound classification comparisons are not calibrated physical snow-area changes or current conditions.
Explore in 3D / The same ground, two summers
Turn the mountain. Compare the snow.
Slide the divider over the same slopes: 2025 is on the left, 2026 on the right. Compare June 23, August 24 or September 16. July is withheld because too little of the same ground is known in both views.
Only views with at least 70% known on the sampled ascent, wider map and upper band are offered. Three fixed-date pairs qualify; the July 23 common-ground comparison is withheld.
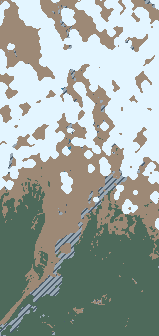
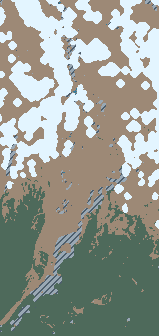
Interactive terrain loads as you reach it. Expand the evidence below for the charts.
Pale areas are snow or ice, not necessarily skiable snow. Grey hatching is unknown—not bare ground.
The red line connects NPS landmarks. It is a reference, not a recorded ski track or a recommended descent.
Map sources, route download and limitations
All 501 May–September dates across 2019–2026 were read. Offered dates need at least 70% known on the same date across the ascent, wider map and upper elevation band. Comparison pairs also need at least 70% common known ground. The three pairs were selected by date and visibility, not snow amount.
The red line connects seven National Park Service waypoints. It is not the recorded ascent used for the article’s 414 samples. Download NPS reference waypoints (.gpx). These landmark connections do not trace an exact travel path.
USGS elevations form the 3D surface, at true vertical scale. Sentinel-2 supplies dated 20-metre snow/ice classifications. Contours are spaced 250 metres apart, with labels every 500 metres. Grey hatching means unknown: it must not be read as bare ground. The view covers the wider Paradise–Camp Muir flank, not Rainier’s summit. The route overlay is a reference line, not a report of current travel conditions.
The maps show the full landscape window; the figures below count only the same 414 sampled ascent cells. Their percentages describe different areas. The 2019–2026 products use different processing versions, so this is an exploratory comparison, not a measured climate trend or a current conditions report.
USGS terrain · Sentinel-2 classification · Map data and sources
August’s contrast reverses in September, when new snow may contribute. The selected July comparison is unreadable. Those gaps and changes are part of the story, not evidence for one year-long snow ranking.
What people actually found
A satellite can show a patch of snow without revealing the rocky walk needed to reach it. Reports from rangers, guides and recreational skiers add what people found underfoot: the approach, the surface and the obstacles between the road and a few turns.
The accounts below come from different dates and sections. Read those details before comparing them. They complement the maps; they do not confirm conditions in a particular satellite image or establish what is happening today.
On the ground / dated accounts
What people found underfoot.
Three historical accounts, each answering a different part of the skier’s question. These are not current conditions or reports from the same day.
Official / climbing rangers
Pebble Creek → Muir Snowfield
A dry trail, then mixed rock and snow.
Rangers described a dry approach to Pebble Creek, with rock and snow above roughly 7,500 feet. They also reported water running beneath the snow.
Helps you askWhere might walking turn into snow travel?
- Source
- Mount Rainier Climbing Rangers
- Observed
- Recent conditions; exact dates unspecified
- Published
- August 17, 2026
How to read this account
A route update, not a measured snow survey. The post combines recent observations; its photo dates do not date every statement.
Professional / guide team
Paradise → Glacier Vista approach
Snow above. Mostly bare trail below.
The guide team estimated that about 80% of the Paradise–Glacier Vista trail was snow-free, while describing snow on the Muir Snowfield farther up.
Helps you askHow much of the approach might mean carrying skis?
- Source
- Alpine Ascents International
- Observed
- Recent conditions; exact dates unspecified
- Published
- June 15, 2026
How to read this account
An estimate for one approach section, not 80% of the full climb. Exact observation times were not supplied. Company role is verified; no individual observer qualification is assumed.
Community / firsthand ski report
A snow patch above Pebble Creek
A few turns after a rocky approach.
The skier described a small patch around 7,600 feet and an awkward scree approach. Their account of skiing there is firsthand; comments about ice higher up came from other people.
Helps you askWas finding snow the same as finding a good outing?
- Source
- NoAirBlair · Turns All Year
- Trip date
- September 12, 2025
- Published
- September 14, 2025
How to read this account
One person’s trip, not a survey of the snowfield. Professional credentials were not verified.
Which report deserves more weight?
Start with official forecasts, closures and field observations, then professional reports and community accounts. Read their dates and locations before comparing them. A recent firsthand report from your intended approach may add detail missing from an older official update; it does not cancel an official closure or hazard forecast.
Different elevations, aspects and times of day can explain apparently conflicting accounts. Keep the disagreement visible if you cannot resolve it. A report that mentions no avalanche is not evidence that the snow was stable. No numerical safety score is calculated here.
For a trip now
Check the latest issued information.
Open the source, check its issue date and the area it covers. The historical reports above do not update automatically.
Before you shoulder the skis
Start with the part of the journey that could change your plan. How much of the approach requires carrying? Does a recent report describe your intended section, or somewhere higher? Was the surface observed that morning, or weeks ago? A report of enjoyable turns on one patch does not describe the whole climb.
Then check the official access and mountain-weather information, and the applicable NWAC forecast and observations. These links lead to the sources; the historical reports here are not a current forecast or a stability rating.
The eight-year record shows how much the season’s timing can move. The recent maps show why the date and elevation matter, while people’s accounts reveal the work between the road and the snow. Put those questions together before deciding whether the outing fits your experience and the conditions now.
Behind the story: measurements, sources and AI
Station timing. The NRCS daily reports provide separate SWE and physical-depth series. The first seven-day zero-SWE sequences after April 1 begin June 17, 2026 and July 7, 2025, confirmed six days later. Across 2019–2026, starts range from June 17 to July 27. Missing dates cannot join a run. The 2021 depth record has gaps that could hide an earlier zero run; its first witnessed date is not an established disappearance date. Station reports remain provisional, and later snowfall can follow a zero sequence.
Fixed ground and matched dates. An internal November 2019 recorded ascent selects 414 unique native 20-metre cells, including 119 at or above 2,500 metres. It is not a summer survey, complete tour or measure of route length. The public NPS landmark reference is a separate orientation line. Snow/ice labels come from the Sentinel-2 scene classification; vegetation can hide ground snow, and uncertain classes remain unknown. Comparable pairs exclude water and use identical ground cells. June 23 has 314 common cells, all snow/ice in both years; 100 others are excluded. August 24 has 174 versus 110 snow/ice cells out of 409, with 89 versus 35 out of 119 higher cells. September 16 has 127 versus 197 out of 411. July’s 279 common cells fall below the 70% comparison threshold, so its snow difference is withheld.
Visibility and selection. The expanded study read 501 primary dated satellite windows across May–September 2019–2026. Dates and comparison pairs were selected using coverage/calendar rules, not snow amount. A reader-usable view requires at least 70% known in the ascent, wider map and upper band simultaneously. 2025 offers 39 such views versus 31 in 2026. Under the registered ranking, 2026 has the shorter worst within-month usable gap, 10 versus 15 days; both have a 15-day worst gap across the full summer. Neither year is uniformly better observed. Clouded dates and failed comparison candidates remain in the evidence.
AI and checks. AI agents helped retrieve records, sample fixed locations and compare the years. Original-pixel checks test whether exports reproduce source values, not whether every label matches ground conditions. Processing vintages vary across the archive; the displayed recent pairs use 05.11 versus 05.12. A processing update can change a label without a physical change below. These are exploratory classifications, not calibrated snow-area changes or a climate trend. Field reports remain separately attributed accounts; no satellite/report match or current avalanche bulletin is claimed here.